Boosting Business Reliability with Uptime Kuma - Installation and configuration guide


Welcome to the fourth post in our blog series on mastering Portainer and open-source software. Today, we will explore Uptime Kuma, a self-hosted monitoring tool that helps you keep track of the uptime and performance of your services and websites. We will discuss its benefits for businesses, potential use cases, and provide a step-by-step guide to set it up in Portainer, along with a simple tutorial on configuring your first test.
Why Uptime Kuma?
Uptime Kuma is a versatile and powerful tool designed to monitor the uptime and response times of your websites, APIs, and other services. For businesses, ensuring that critical services are always available is paramount. Downtime can lead to lost revenue, decreased customer satisfaction, and damage to your brand reputation.
Key Benefits of Uptime Kuma:
- Real-Time Monitoring: Get instant alerts when a service goes down.
- Detailed Metrics: Track response times and uptime percentages.
- Customizable Alerts: Receive notifications via email, SMS, or integrations with other services.
- Historical Data: Analyze trends over time to identify performance bottlenecks.
Use Cases for Uptime Kuma:
- Website Monitoring: Ensure your website is always accessible to customers.
- API Monitoring: Track the performance and uptime of APIs critical to your business operations.
- Service Monitoring: Monitor internal services like databases, mail servers, and more.
- SLA Compliance: Maintain service level agreements by keeping a close eye on uptime metrics.
Setting Up Uptime Kuma in Portainer
Follow these steps to install and configure Uptime Kuma in Portainer:
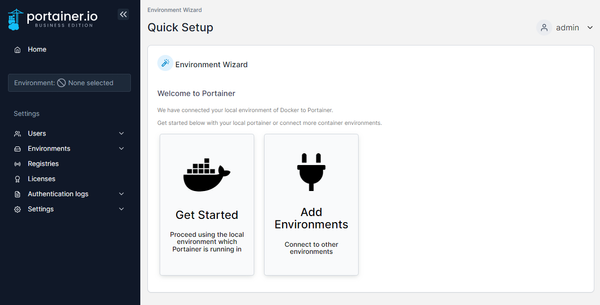
- Log into Portainer:
Open your web browser and navigate to your Portainer instance. - Create a New Stack:
In the Portainer dashboard, go to Stacks and click on Add stack. - Configure the Stack:
Name your stack (e.g., uptime-kuma) and add the following stack configuration:
version: '3'
services:
  uptime-kuma:
    image: louislam/uptime-kuma:latest
    container_name: uptime-kuma
    ports:
      - "3001:3001"
    volumes:
      - uptime-kuma-data:/app/data
    restart: unless-stopped
volumes:
  uptime-kuma-data: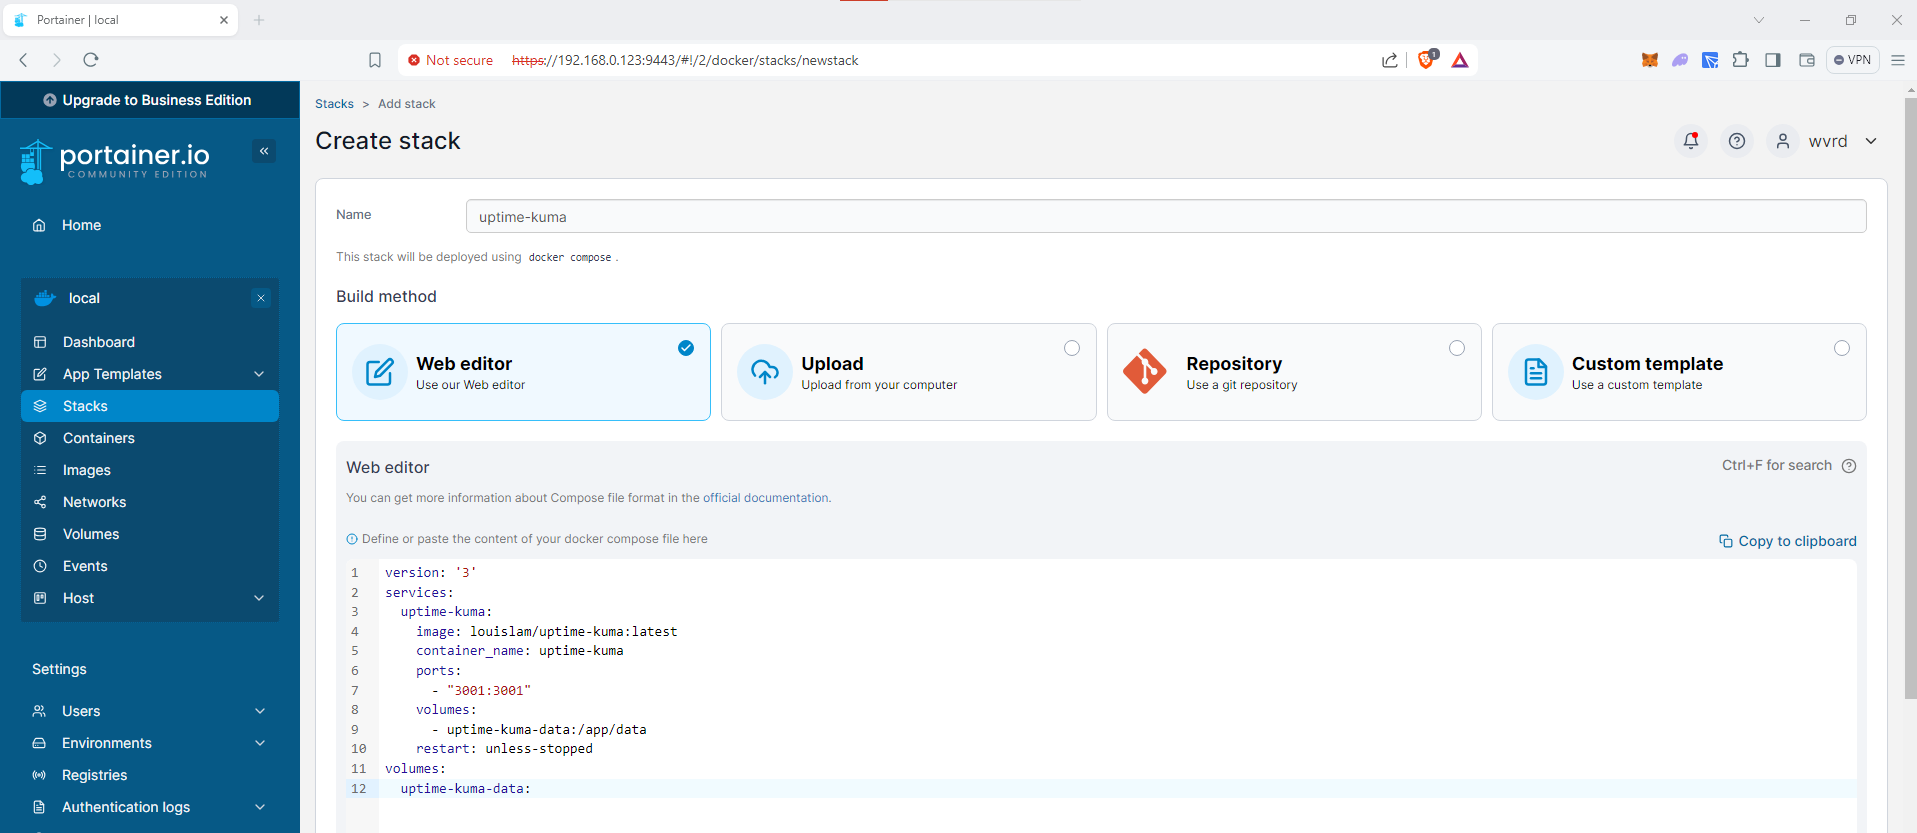
4. Deploy the Stack:
Click Deploy the stack to start the Uptime Kuma service within Portainer.
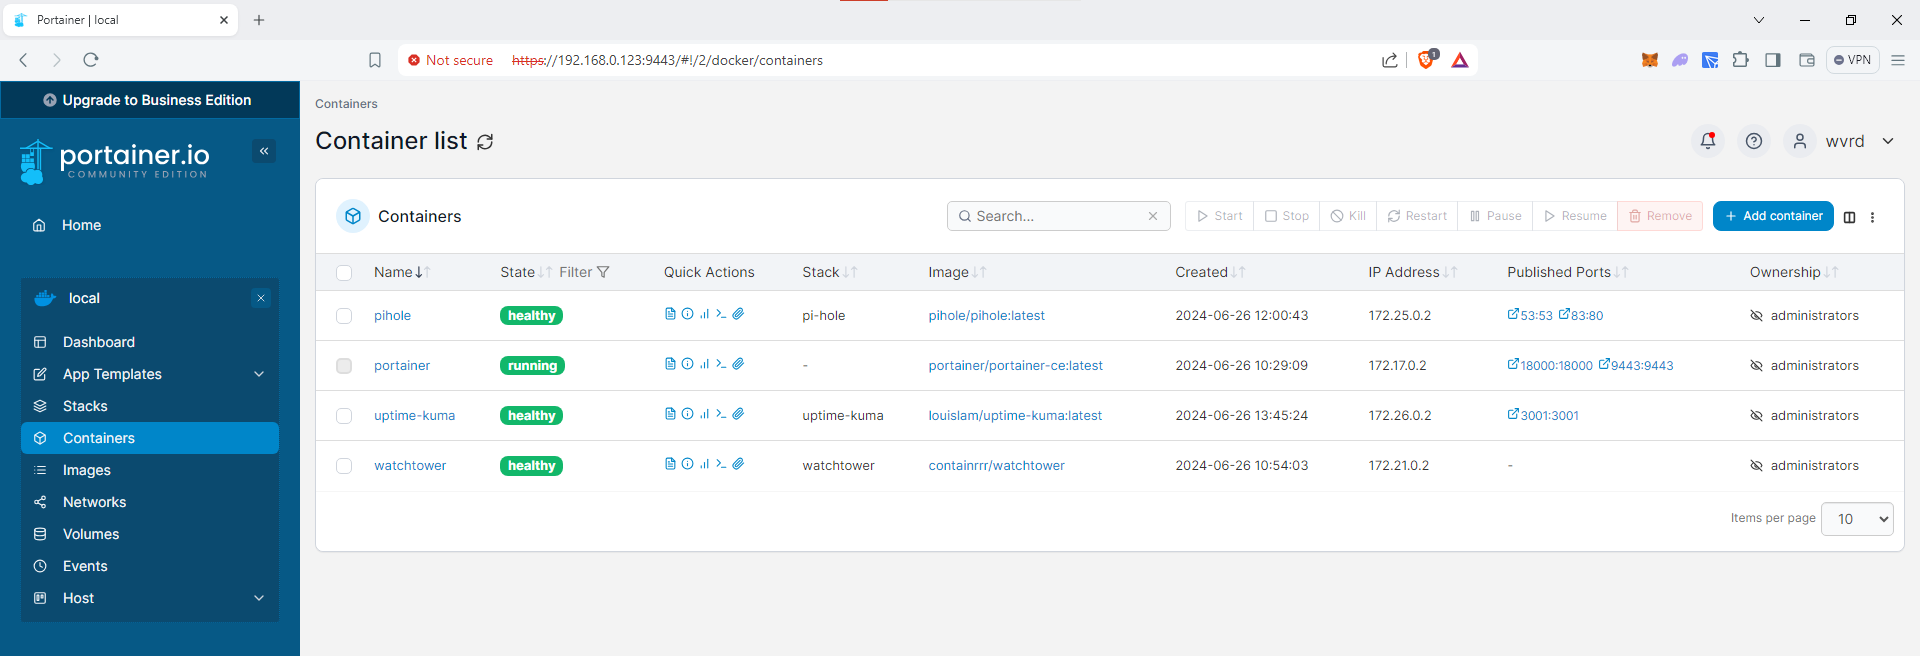
- Verify Installation:
Check if the Uptime Kuma container is running by navigating to the Containers section in Portainer.
Configuring Your First Test
Once Uptime Kuma is up and running, follow these steps to configure your first test:
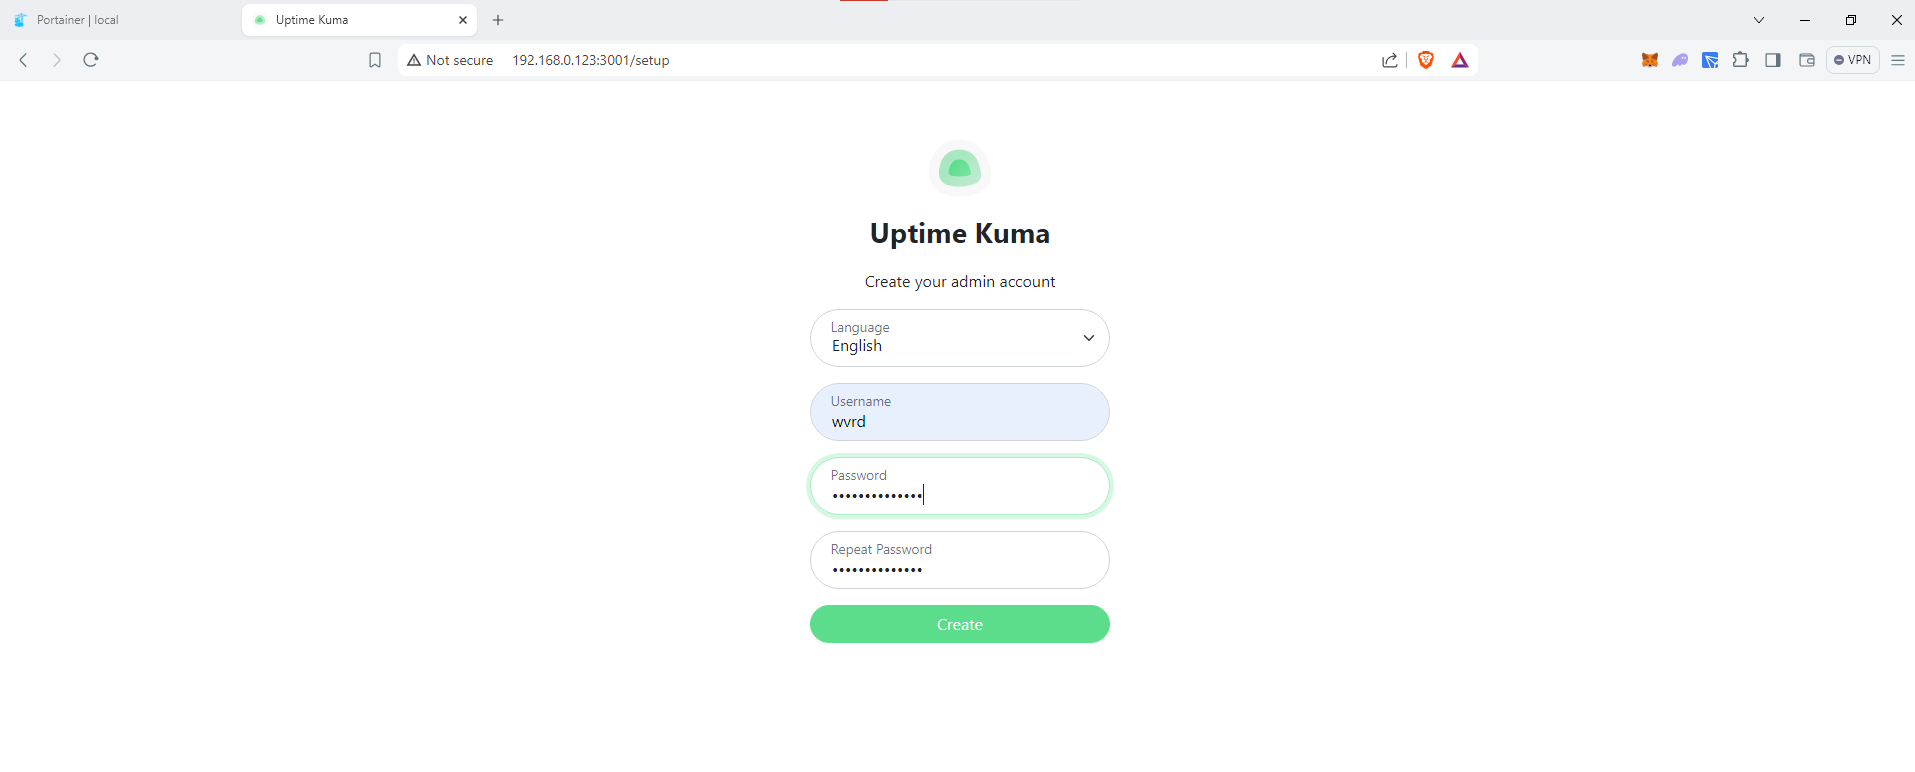
Access Uptime Kuma Admin Interface:
Open your web browser and navigate to http://your-server-ip:3001. Follow the setup wizard to create an admin account.
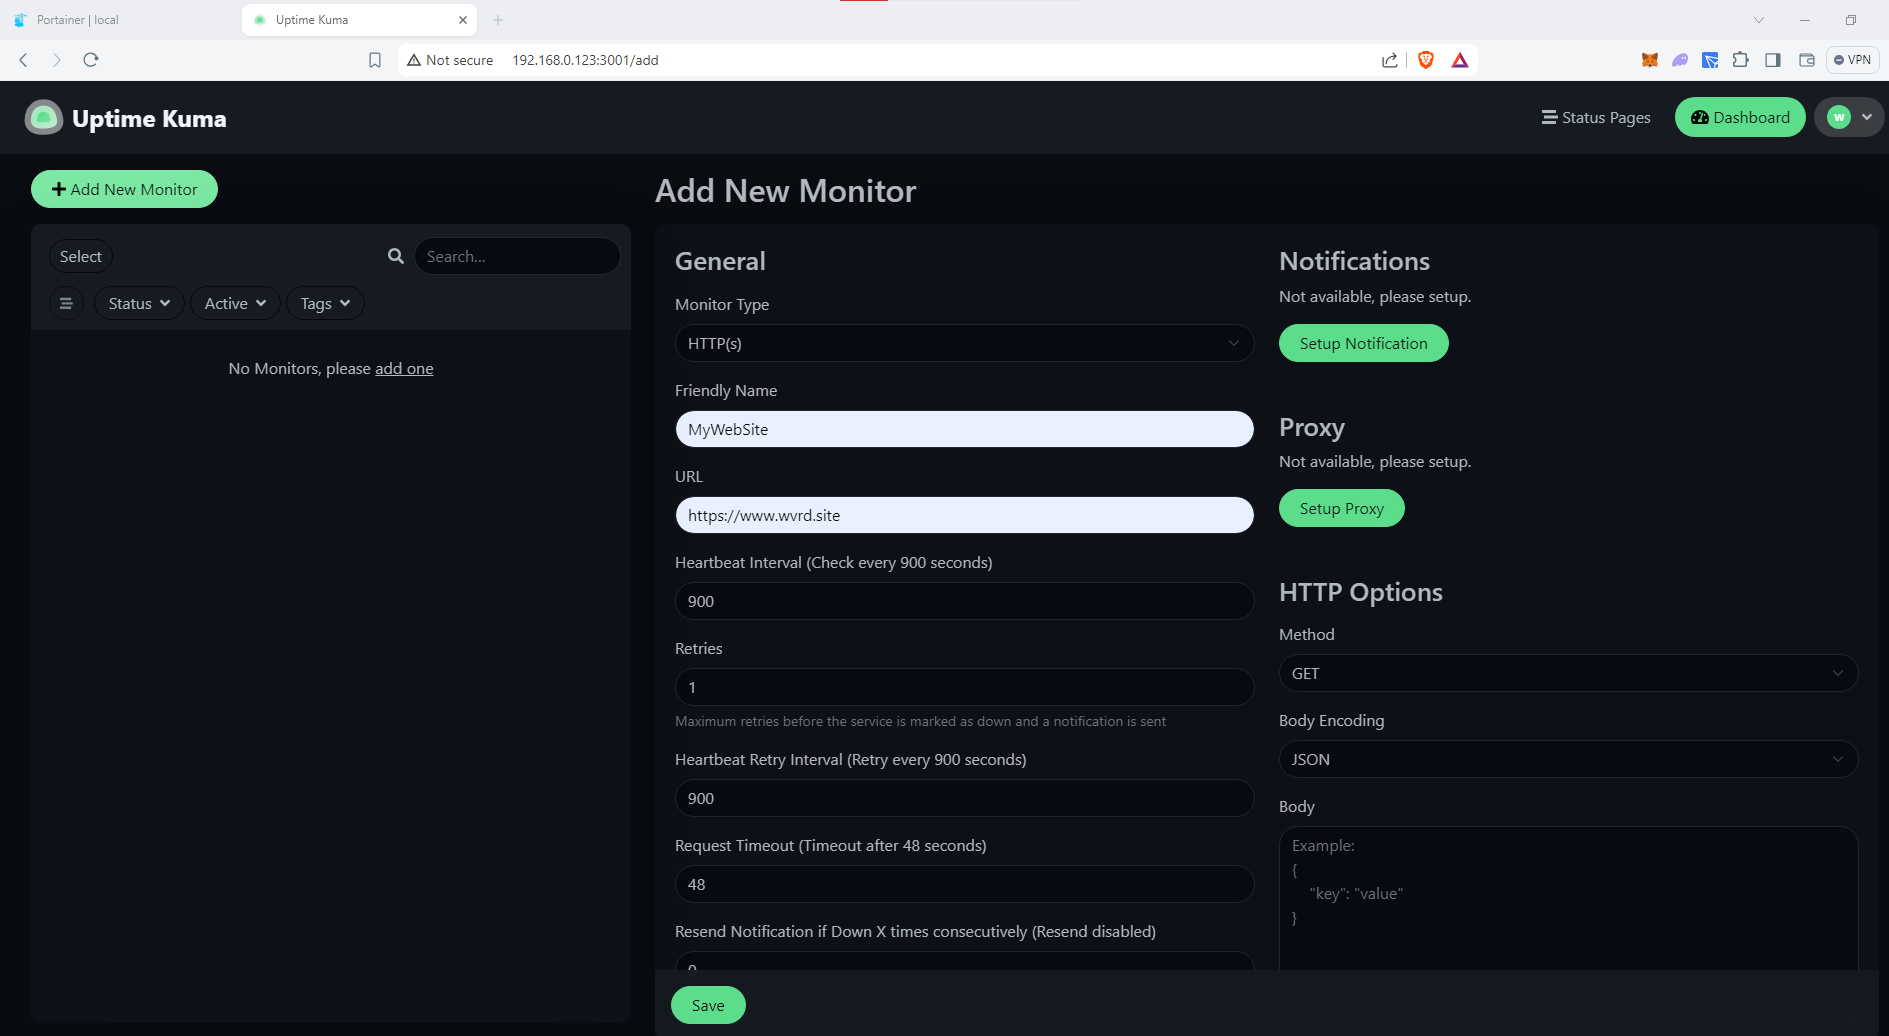
Add a New Monitor:
- Click on Add New Monitor.
- Select the monitor type (e.g., HTTP(s) for website monitoring).
- Enter the URL or IP address of the service you want to monitor.
- Configure the monitoring interval and other settings as needed.
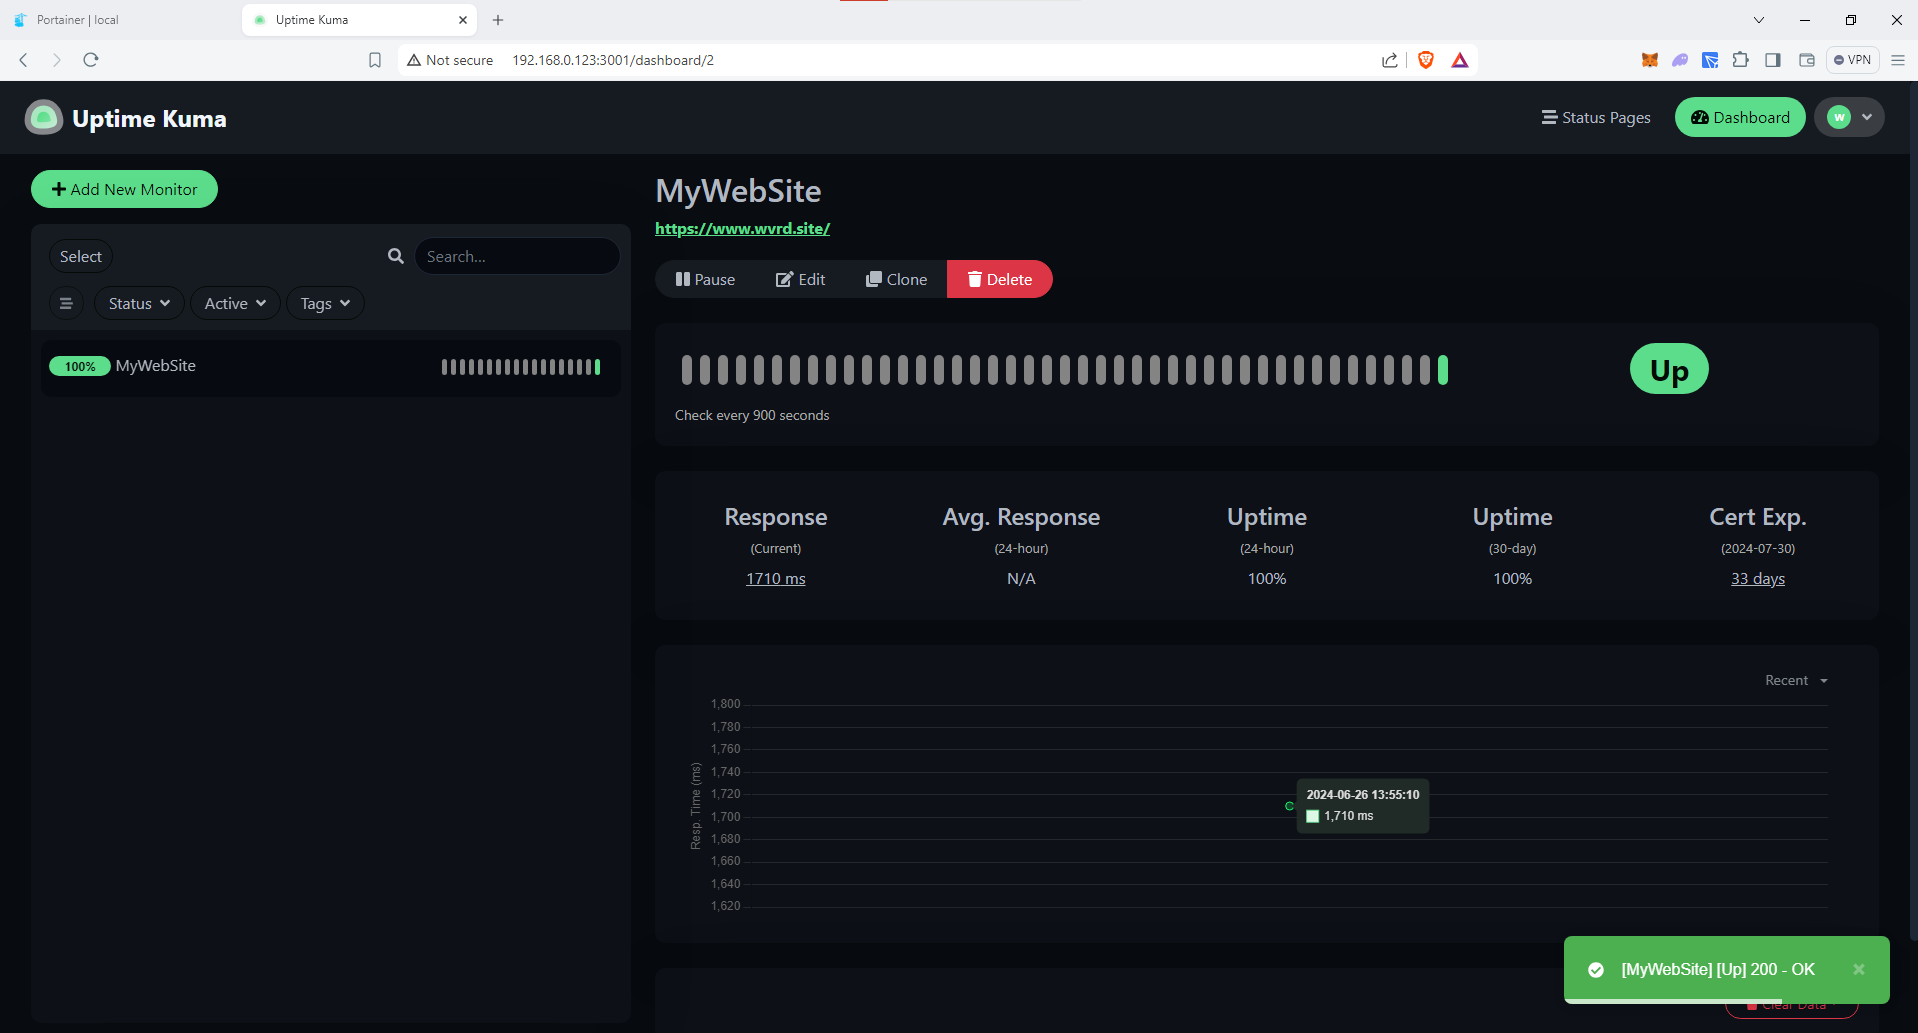
- Click Save to create the monitor.
Configure Alerts:
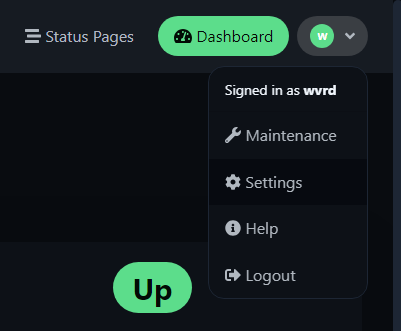
- Go to the Settings tab.
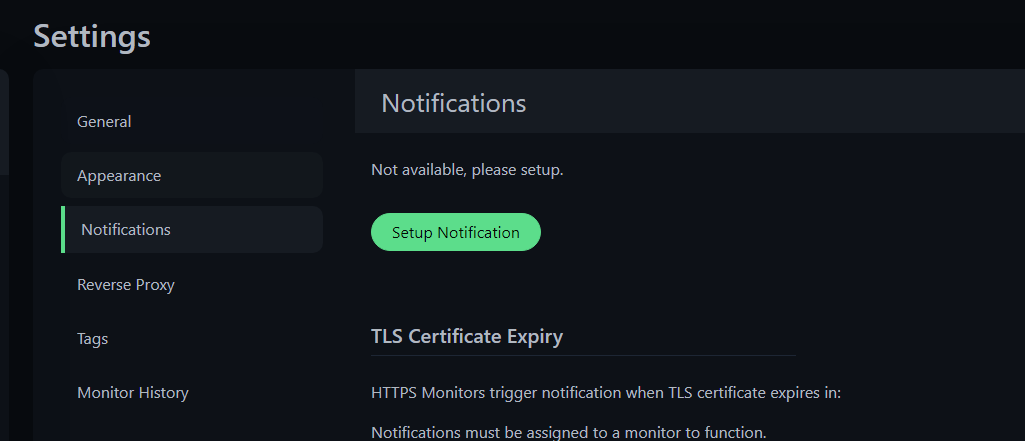
- Set up notification channels (e.g., email, Slack, or webhook) to receive alerts.
- Configure alert rules to define when notifications should be sent.
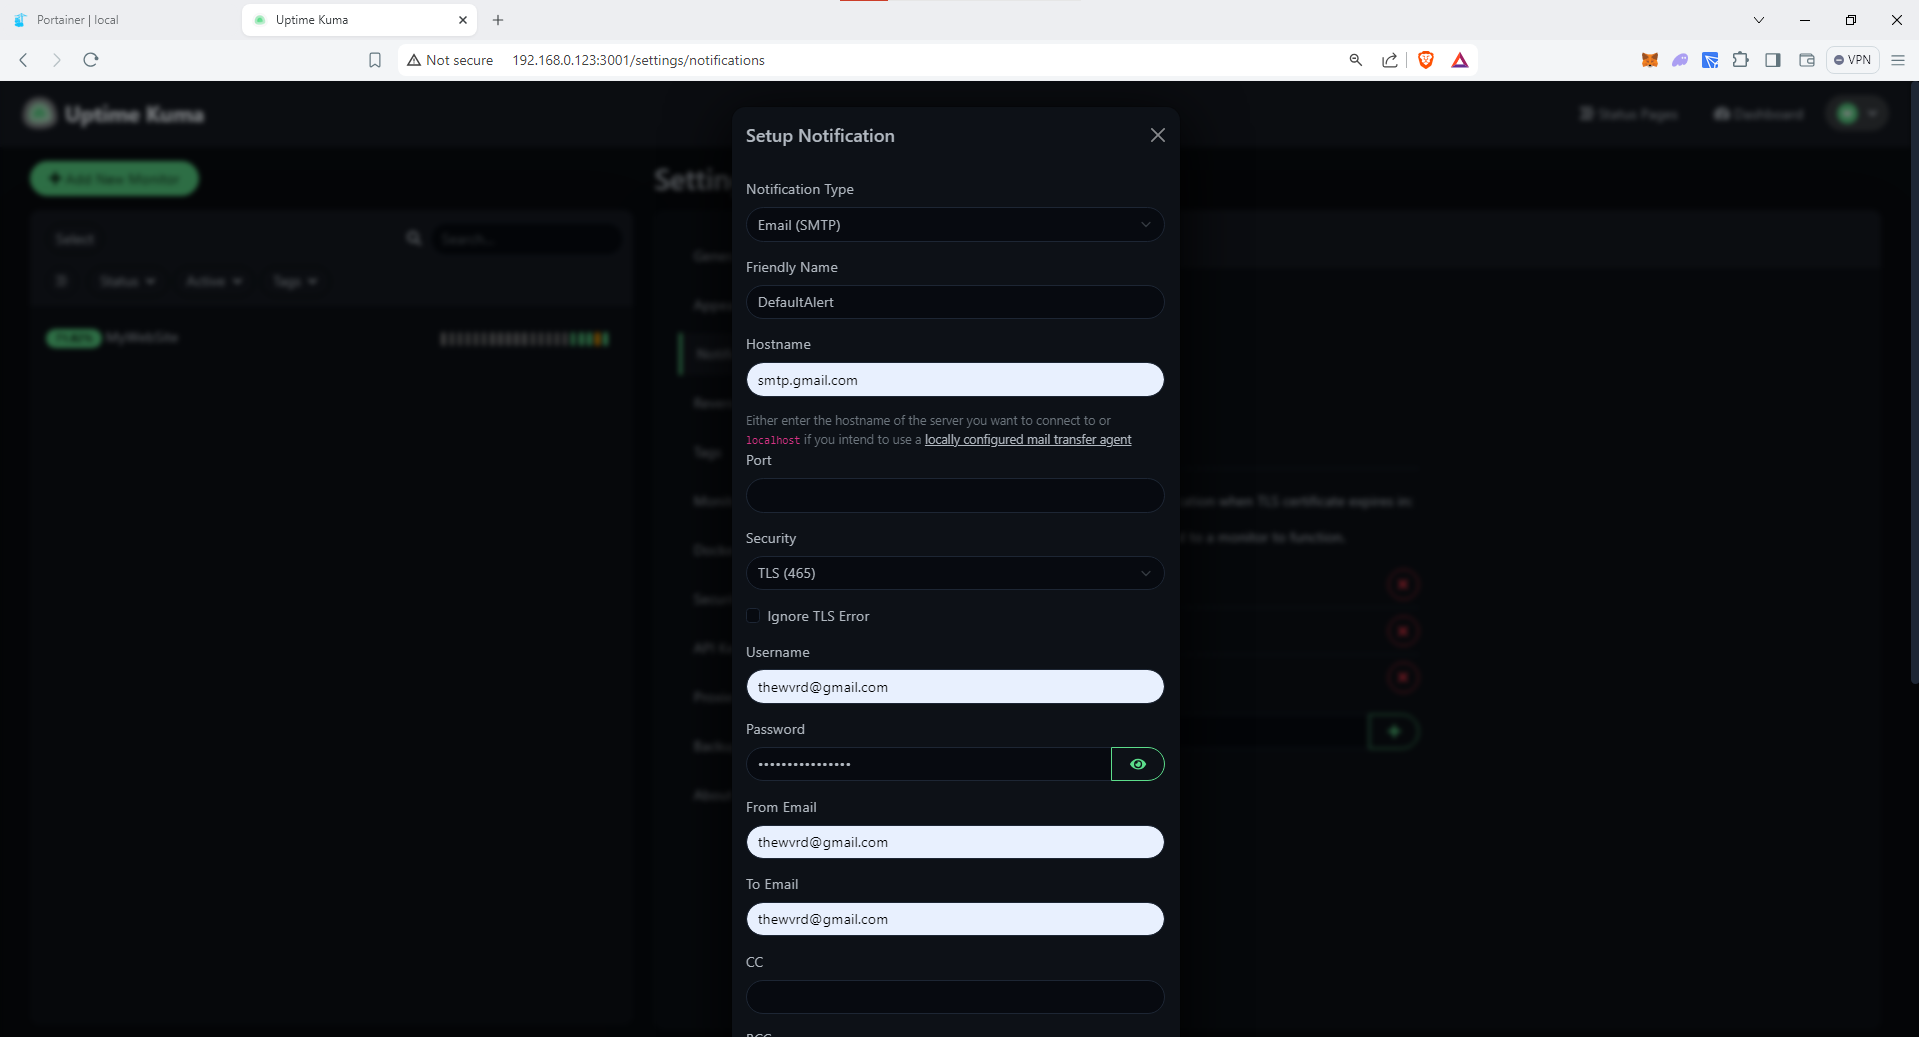
Configure the below to setup alerts via your GMAIL:
Notification type: Email(SMTP)
Friendly Name: Default Rule
Hostname: smtp.gmail.com
Port: 465
Security: Choose TLS (465)
Username: [email protected]
Password: "do not use your actual GMAIL password, you will need to setup an App password for your account to get this working" - Remove spaces in between the app password - https://myaccount.google.com/apppasswords
From Email: [email protected]
To Email: [email protected]; [email protected]
Default Enabled: True (if preferred)
Apply on all existing monitors: True (if preferred)
Click to save the alert and you're good to go.
Conclusion
Uptime Kuma is an invaluable tool for businesses that want to ensure their services are always available and performing well. By setting it up in Portainer and configuring your first test, you can start monitoring your critical services in no time. Stay tuned for more posts in this series as we continue to explore powerful open-source tools and how to manage them using Portainer. Happy monitoring!